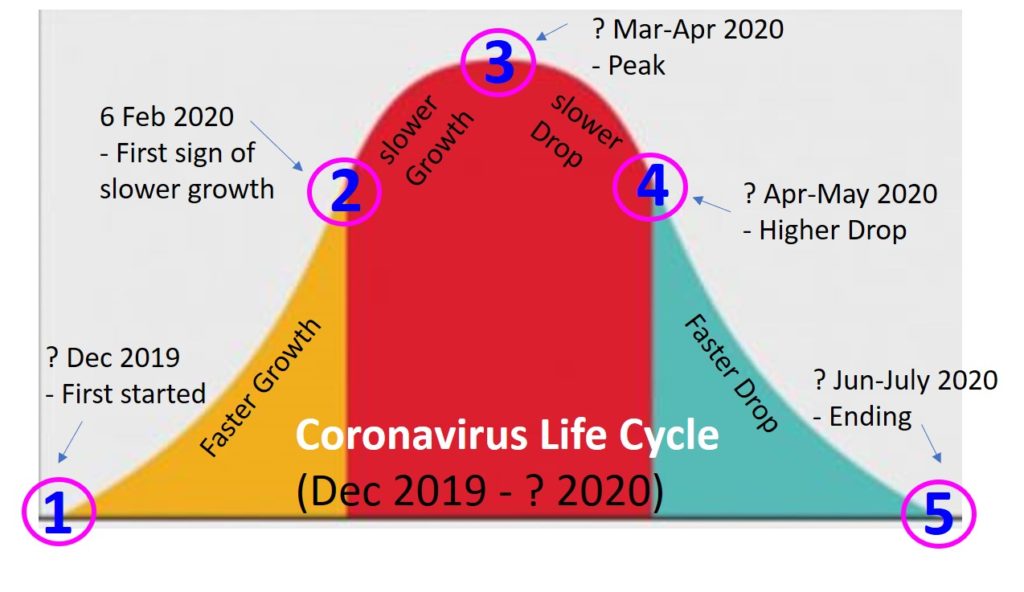
This is a preliminary Coronavirus life cycle model, assuming similar pattern as SARS (8 months duration), initiated in Dec 2019, currently 7 Feb 2020 with about 1+ month of reported data which was reported here.
We start to observe the first sign of slower growth on 6 Feb 2020 (number daily new cases started to drop from 5 Feb 2020, but downtrend only observed for 2 days so far, # death is still increasing). This early signal (mark as No 2 on chart) is significant as it shows that the isolation measures globally (especially in Hubei of China) may be effective but similar to stock market, longer trend (eg. over 1 week) is required to establish a more consistent trend.
If the slower growth may continue, there is a possibility that spreading of Coronavirus may reach a peak in Mar-Apr 2020, to be finetuned when there are more daily updates. From past experience, the virus lose its strength in summer, therefore it is a must to end it by Jun-July summer time, otherwise it may become a common flu, coming back every 6 months (2 winters globally in each hemisphere).
Here are past analysis data: https://www.facebook.com/ein55/photos/a.213596708842919/1226240390911874/
Similarly, stock market also has its own life cycle, bull (price growth) and bear (price drop) take turn to dominate, but stock market cycle is much longer, typically over 5-10 years, more dependent on optimism, not on exact duration.
For both life and stock investment, we could only focus on those we could control (eg. what stocks to buy, which places to go, etc). Stay neutral, the high probability of winning stock or low probability of getting virus would help us, don’t let short term emotions of daily stock prices or daily Coronavirus cases affect us.
Learn to control your investment, learning from Dr Tee on What to Buy, When to Buy/Sell for global giant stocks in a dream team portfolio. Register Here. www.ein55.com

