New Year 2017 – Bull or Bear Market? Learn 2 Winning Strategies for Stocks

ein55-newsletter-no-047-image-bull-or-bear-2017

New Year 2017 will be an exciting year for global stock market with Donald Trump as the new US president, recovery of emerging markets and crude oil market, rising interest rate and a bullish US economy. Let’s learn how to position in stock market with 2 winning strategies: 1) Buy Low Sell High, 2) Buy High Sell Higher.

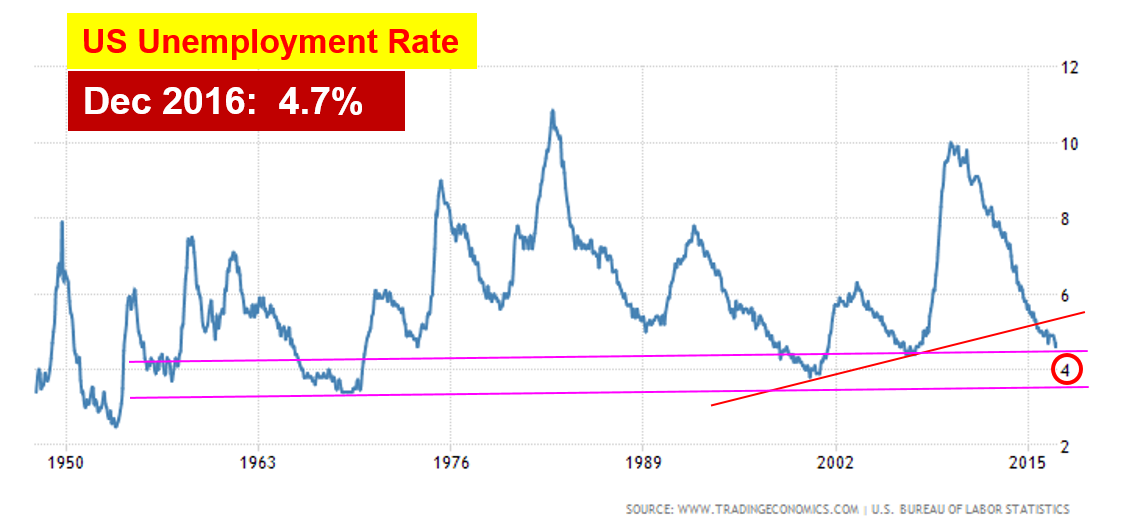
US contributes to 40% of global stock value, therefore it should be a key focus to understand the stock market outlook in year 2017.  US economy has been consistently bullish, supporting the stock market.  US unemployment rate has declined by half from 10% to 4.7% in Dec 2016.  Based on the historical unemployment rates of US since year 1950 (see chart below), we could observe that US economy is entering the last phase of bull run as the unemployment rate is falling below 5%, moving towards the critical 4% value, reflecting the peak of US economy.

Lower unemployment rate implies more new jobs are created, therefore more spending power, which helps the business to grow with higher sales, eventually reflecting as higher stock prices due to stronger fundamental in financial statements.  US stock market has been bullish in the past few years, following the trend of US economy, likely will continue in the New Year 2017.
ein55-newsletter-no-047-image-us-unemployment-rate

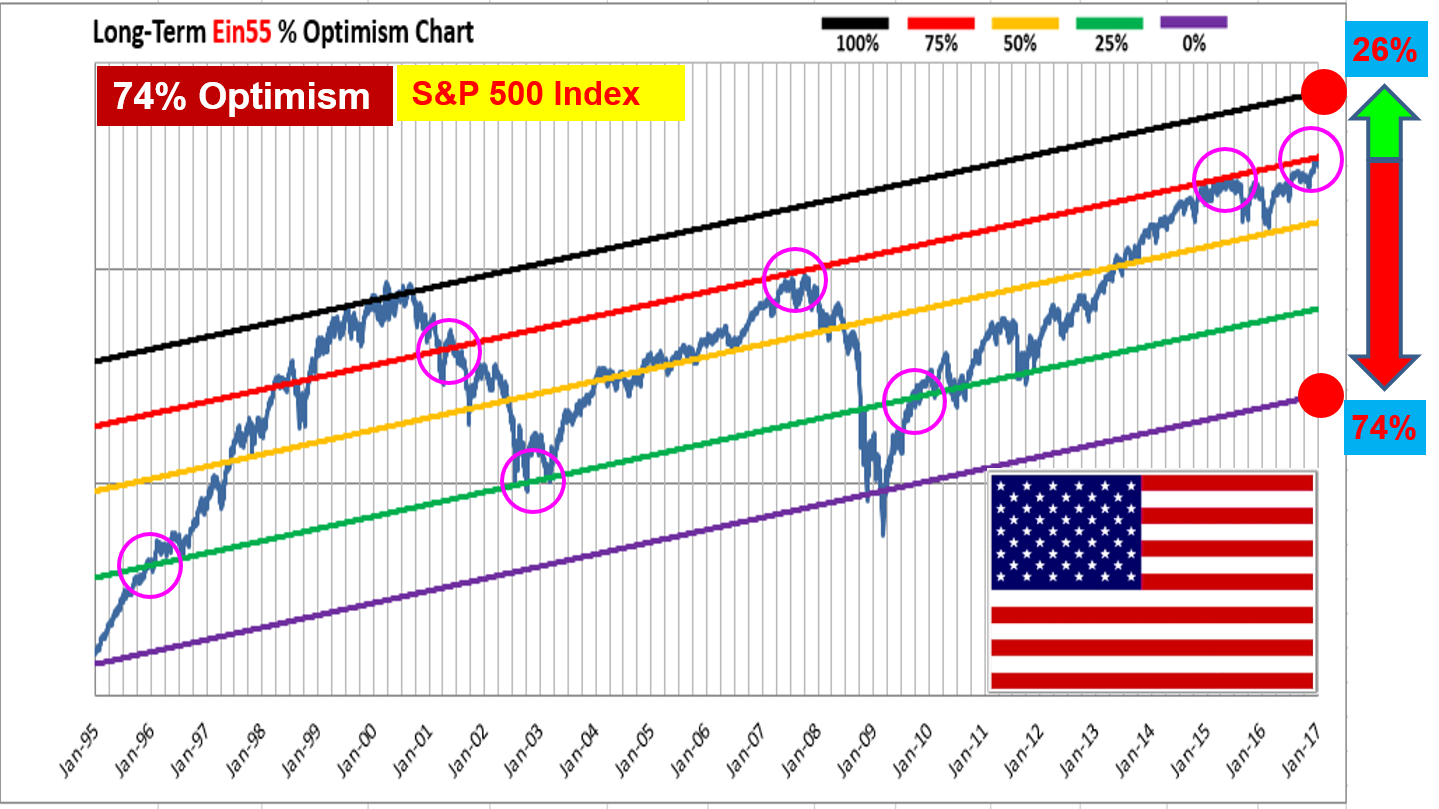
US S&P500 stock index has achieved new historical high on 6 Jan 2017 with 2276 points.  Based on Dr Tee (Ein55) Optimism Strategy, US stock market is close to danger zone with 74% Optimism in long term (see chart below), implying the probability of bear market risk is 74% while the upside potential is limited, only 26%.

There have been mixed feelings in the stock market. Some people have stopped investing, worrying about the peak of US stock market but unknowingly the stock prices become higher and higher with time, they may regret of missing the train, hoping to have the last ride.

There are actually many mechanisms to make money in stocks.  Here are 2 winning strategies for the New Year 2017, to be aligned with one’s unique personality:

1) Buy Low Sell High

This strategy is suitable for long term investors who hope to invest safely, buying good fundamental stock at low price, selling high in future or holding for long term.  Since US and global stock market are approaching higher optimism level, the chances of global financial crisis is high, any unexpected global event in near future could trigger the bear market.

An investor will need to be very patient, ignoring the temptation of the bullish market, taking profit while others are greedy (Optimism >75%), standby enough capital to prepare to buy low when Optimism of global stock market is below 25% again.  Control of emotions is critical to buy low when others are fearful one day.


2) Buy High Sell Higher

Not everyone is an investor, having the patience to wait.  Some people are more suitable for short term trading, which they could follow momentum trading to buy high and sell higher in near future.  A stock price could be at high price but the trend is bullish, therefore the price is sustainable for short term, having the potential to go up even higher with time.

This strategy is more suitable for short term trading in the last phase of bull market, following the trends of stock prices, supported by news, speculations, business, economy, etc.  When the trend has stopped, the traders have to stop as well or applying reversed trend in trading.  Control of emotions are very critical as daily news could affect the traders’ psychology.  The ability to take profit or cut loss is important as the elements of probability are stronger here.

There are other variations of the strategies, eg. an investor could buy low for strong fundamental stocks, sell high for short to medium terms.  This way, an investor could also enjoy the last phase of the bull run in stock market with integration of trading strategies.
ein55-newsletter-no-047-image-sp500-optimism


Which is the Real Black Swan? Learn to Profit from the next Global Financial Crisis

ein55-newsletter-no-039-image-black-swan
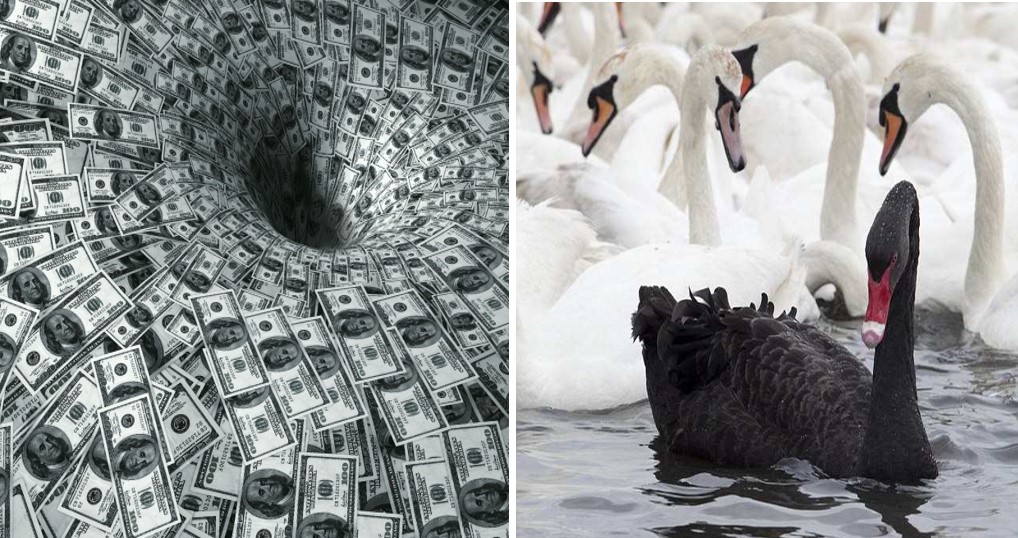
In the ancient time, Europeans thought that swans are all white in colour until one day, black swan was found in Australia, it became a surprised news.  Black swan event is a financial term used to describe an unexpected event which later evolved into global financial crisis.  There were people and company went bankrupt during the downfall of global stock market.  There were also people who took advantage to buy good business at low price, making many times of fortune in a short time when the crisis is over.

Every crisis is an opportunity. However, there are different scales of financial crisis, from Level-1 (company level, eg. Swiber or Noble), Level-2 (sector level, eg. Shipping Industry), Level-3 (country level, eg. Russia) to Level-4 (global financial crisis).  Level-1 crisis happened almost all the time, weak company could wind up the business when the earning, asset or cashflow is insufficient to pay for the debt. Level-2 crisis follows the unique sector market cycle, eg. Oil & Gas crisis, casino crisis, opportunity could be found every few months, suitable only for trading if it is not aligned with higher level of crisis.  Level-3 crisis could happen every year, eg. Euro Debt Crisis (2010-2012), US losing AAA credit rating (2011), China stock crisis (2015), Brexit crisis (2016), creating a good opportunity for both traders and investors.  However, none of them could be named as Black Swan event or Level-4 crisis (global financial crisis), similar to Dotcom Bubble (2001) and Subprime Crisis (2008).

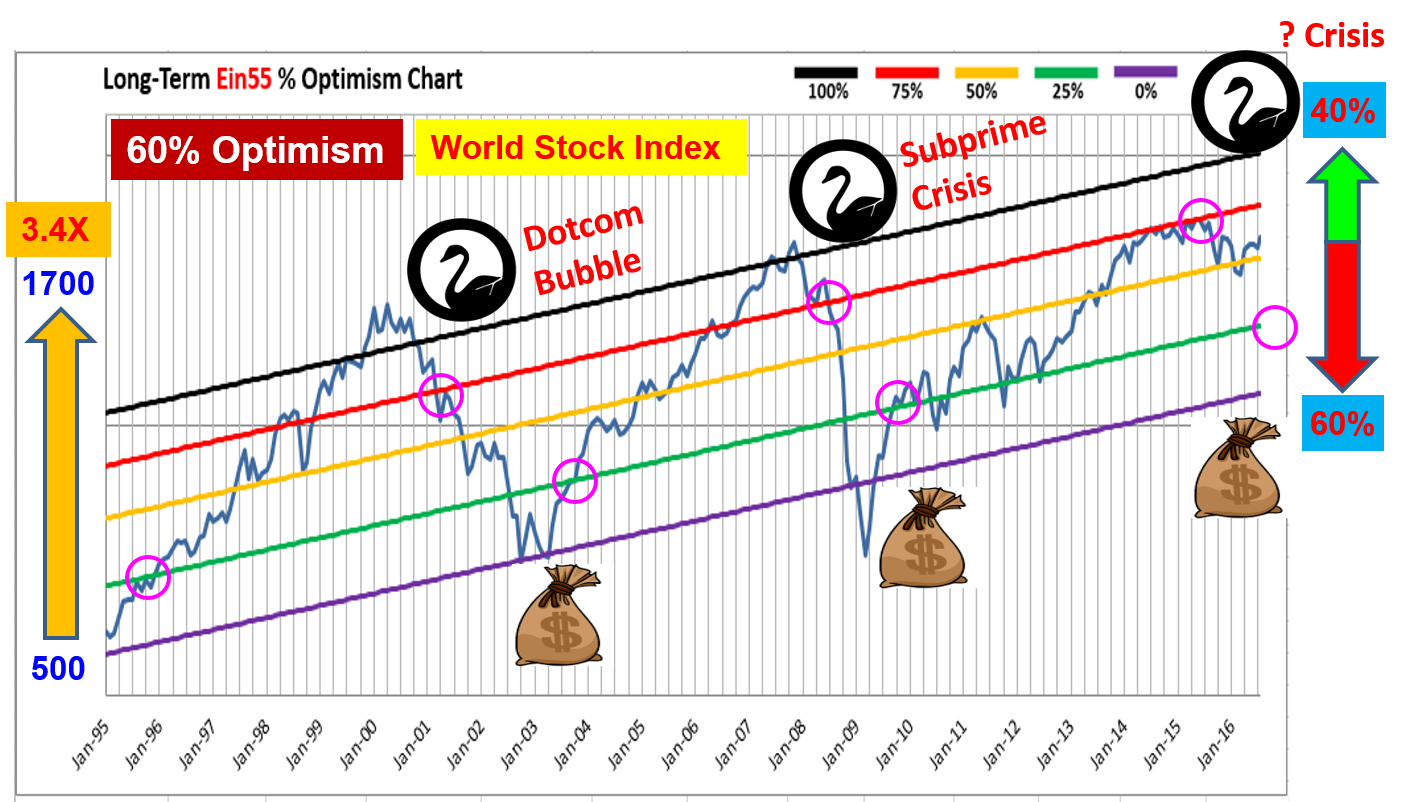
The greatest investment opportunity requires the most fearful financial crisis in an in unexpected way.  Every year in a bull market, many “Dr Doom” will try to predict each event could become the next global financial crisis, but why it usually ended up just a smaller scale of regional crisis?  In fact, each of the yearly financial crisis could become the next global financial crisis but it requires greater fear to trigger.  Based on Ein55 Optimism Strategies (see chart below), global financial crisis will more likely to occur when world stock index is over 75% optimism, eg. in year 2000 (which triggered the dotcom bubble in 2001) and year 2007 (which triggered the subprime crisis in year 2008).  For other smaller scale crisis (Euro Debt, Brexit, US credit crisis, etc), world stock market was at mid optimism level (<60%), it was not greedy enough, therefore the global investors were also not fearful enough to escape at the same time when crisis happened.

In the past 20 years, world stock market has gone up 3.4 times in share prices (see chart below), a highly profitable investment option. World stock market index was at the critical 75% Optimism in year 2015, the global stock market correction has helped to cool down to moderate high level of 60% Optimism.  With US S&P500 index reaching historical high every few months, world stock market has been increasing in optimism level, risk is getting higher each day (40% upside, 60% downside) but not back to the critical level yet.  If there is still a last rally, global stock market could be speculated to a high optimism level, the black swan of the next global financial crisis will be likely to wait there.  We don’t have to guess what and when is the black swan event because it is unpredictable in nature, therefore it is called a black swan. However, Ein55 Optimism Strategies could help us to prepare for that golden opportunity in future.  As long as we are not too greedy, taking profit at high optimism (>75%), we could save enough capital, overcome our fear to buy low at low optimism (<25%) and hold until recovery of world economy, making profit from global financial crisis.

ein55-newsletter-no-039-image-world-stock-index


Stock & ETF Investing Opportunity in BRICS – Emerging Countries

Ein55 Newsletter No 026 - image - BRICS

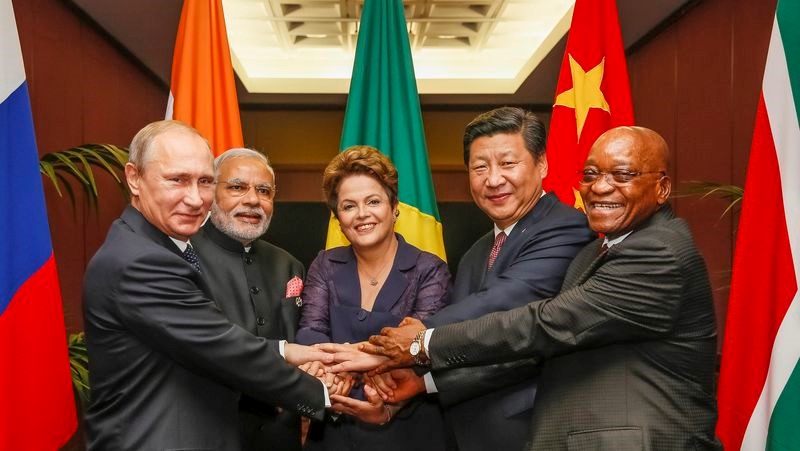
Due to global economy slowdown in the last few years, stock markets in the emerging countries have suffered significant corrections, resulting in Level-3 (country/region) crisis.  The leaders of emerging countries are BRICS (Brazil, Russia, India, China & South Africa), stock prices are now at very attractive prices.  When the global economy starts to recover and accelerate, these emerging stock markets will benefit as well.  One could use ETF to trade or invest global stock indices.

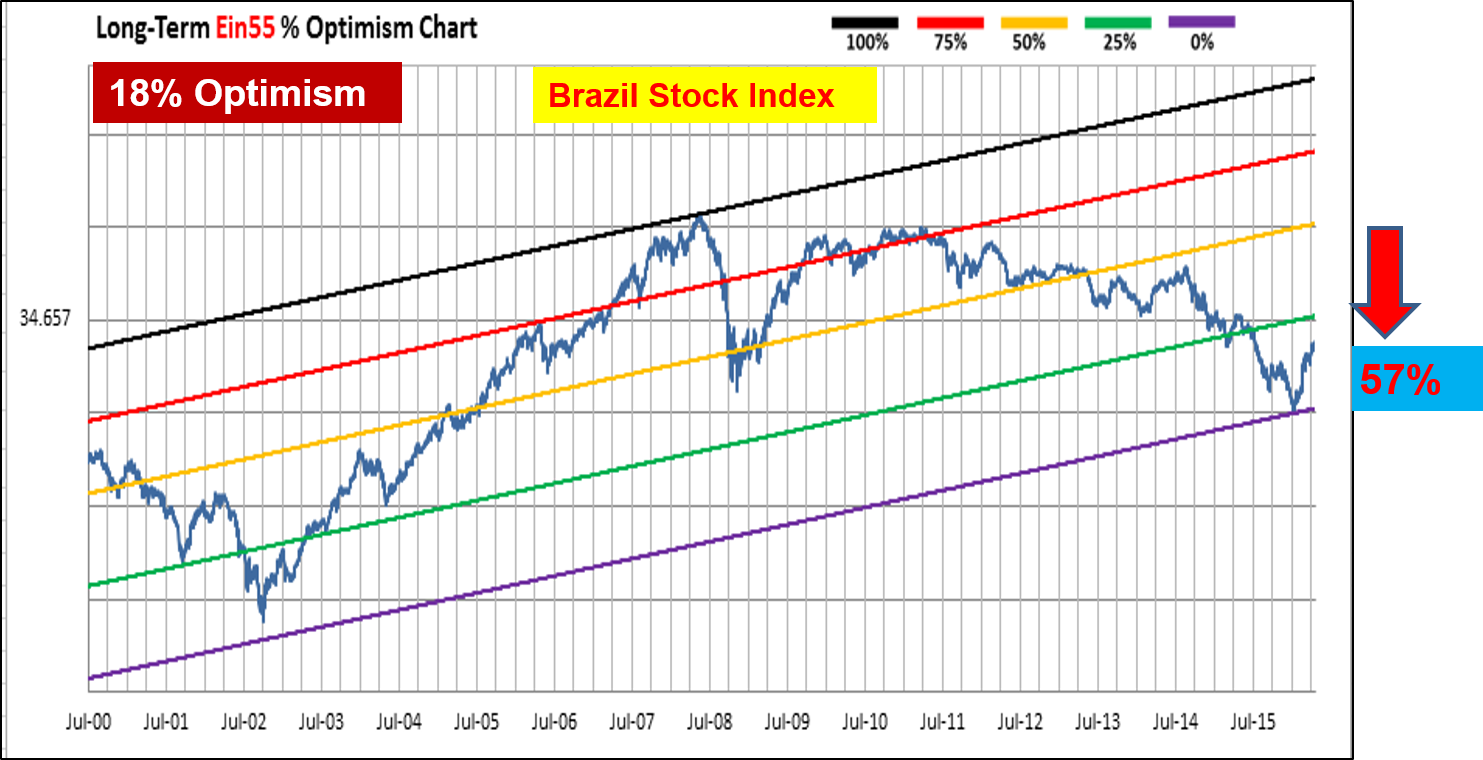
Due to economy and political instability, Brazil stock market now is at 18% Optimism, after 57% correction in stock prices (see chart below).

Ein55 Newsletter No 026 - image - Brazil

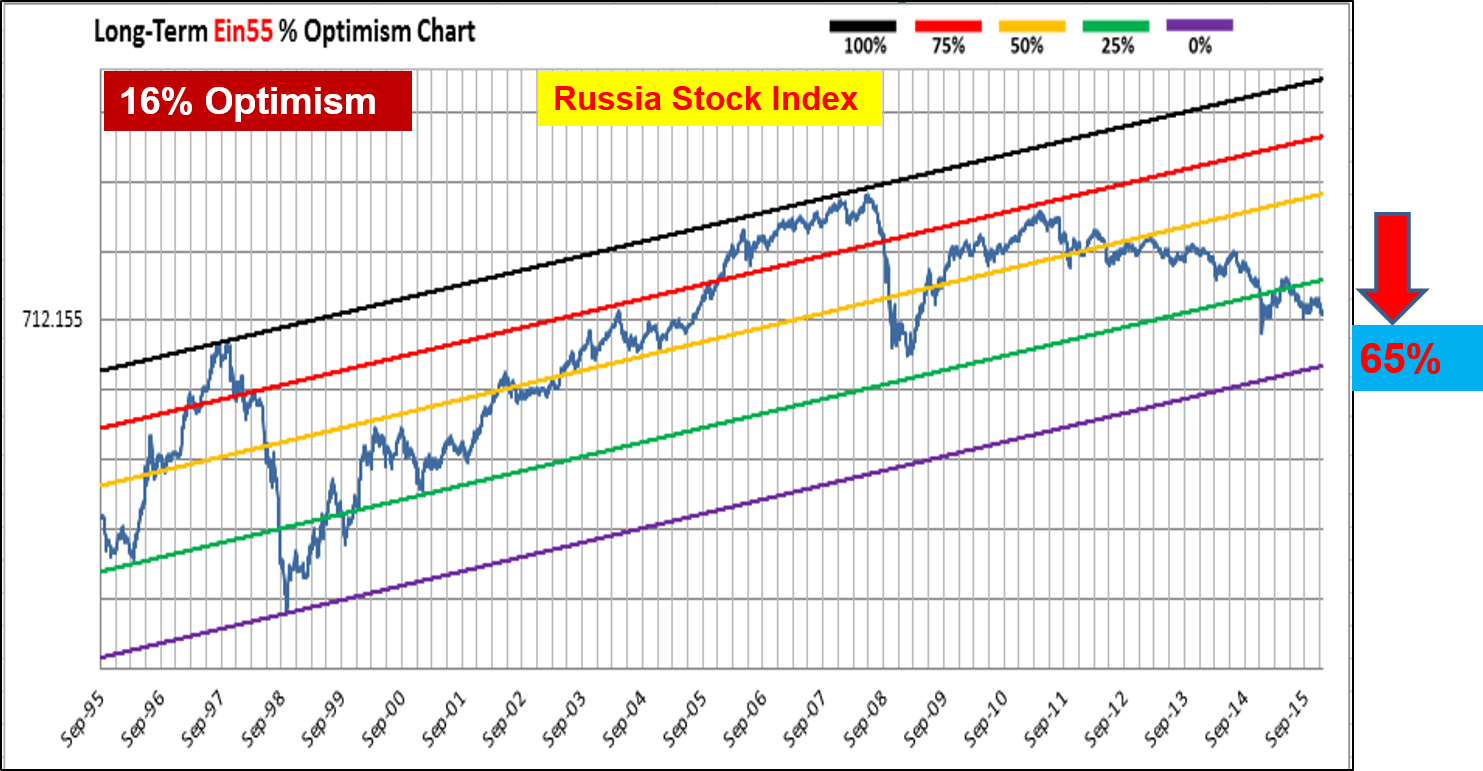
Russia has suffered from falling in global oil price, economy is severely affected. Russia stock market now is at 16% Optimism, after 65% correction in stock prices (see chart below).

Ein55 Newsletter No 026 - image - Russia

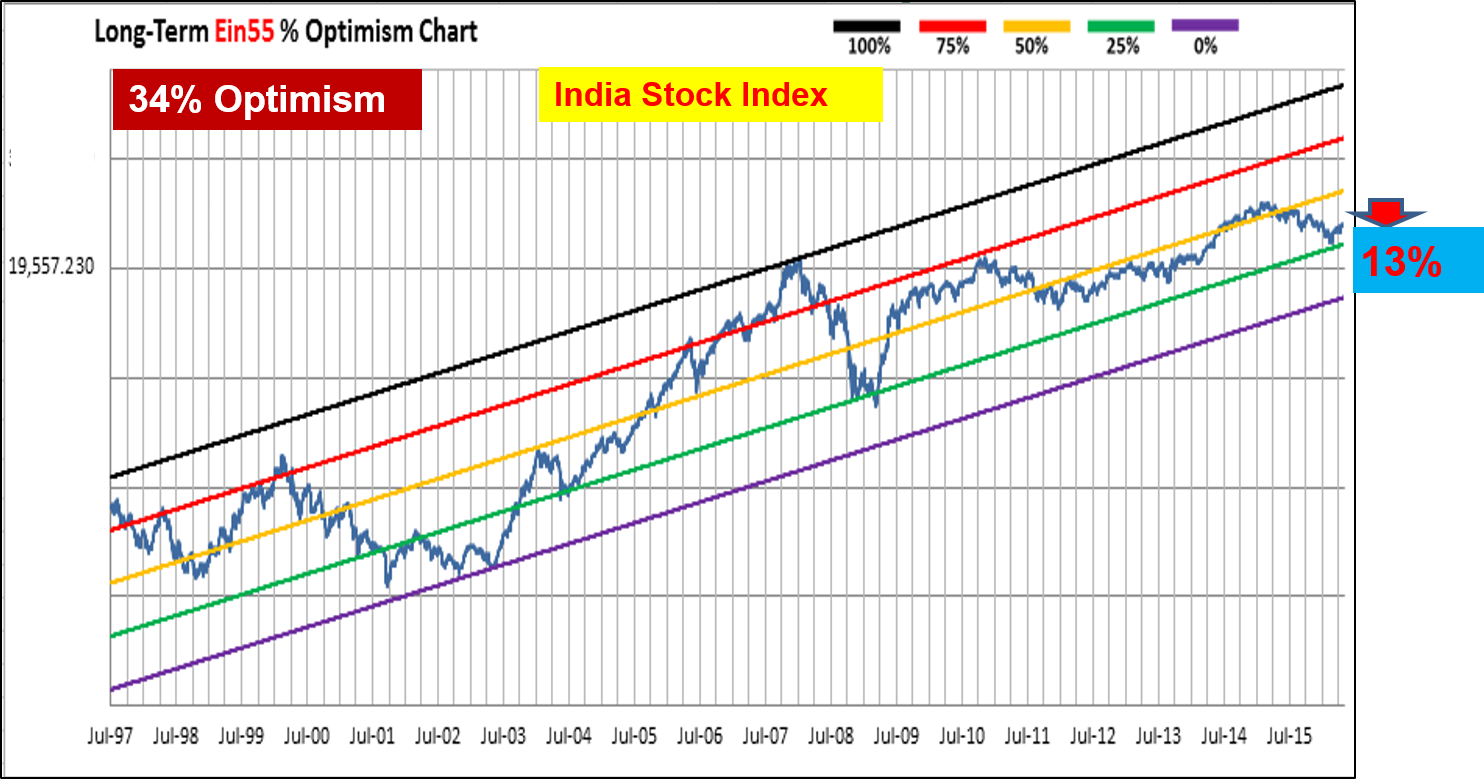
India is relatively stronger compared to other BRICS, stock market now is at 34% Optimism with only 13% correction in stock prices (see chart below).

Ein55 Newsletter No 026 - image - India

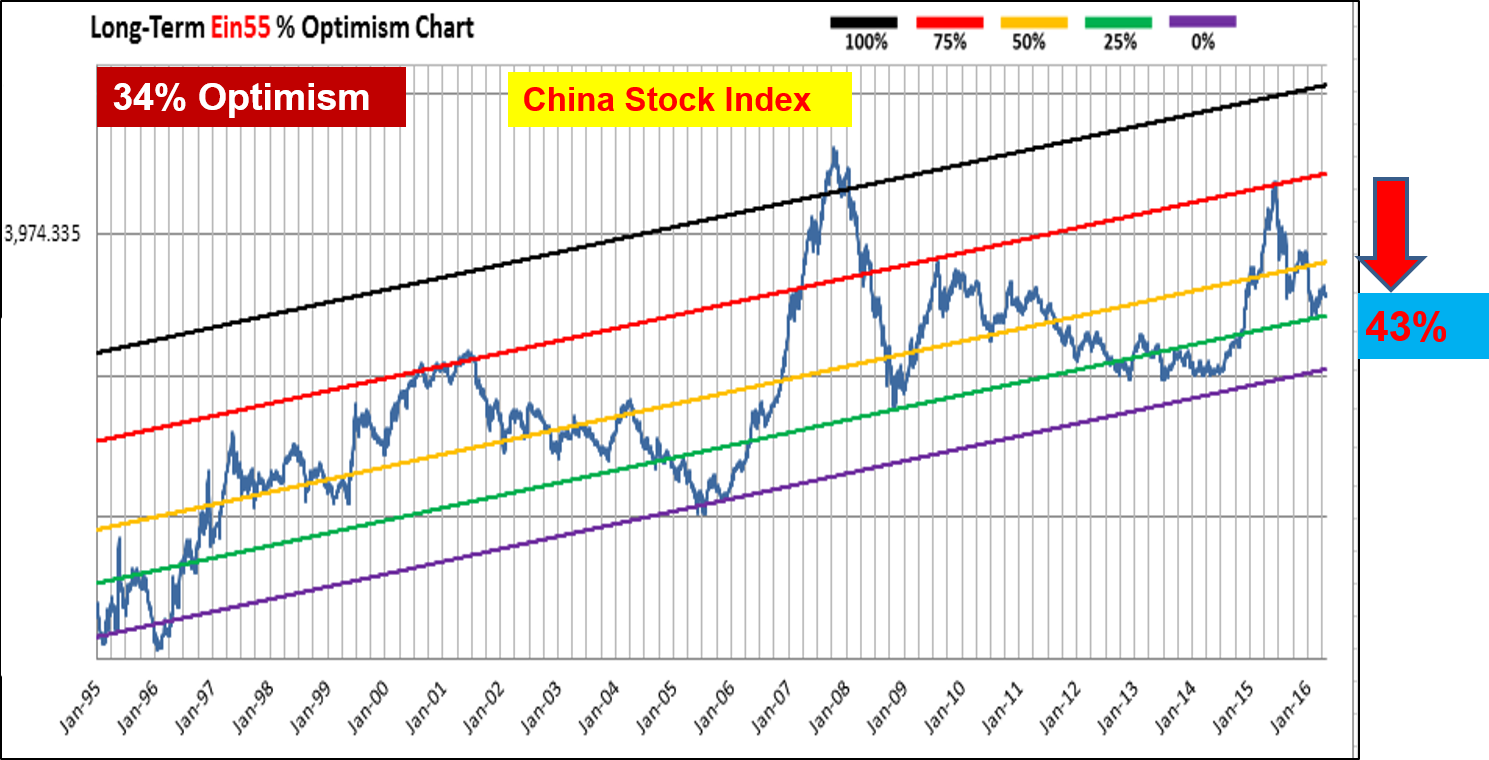
China is world No 2 economy, although Optimism is similar to India at 34%, stock prices have heavily corrected by 43% after the last round of speculative bull run, falling down from peak of 5200 points (see chart below).

Ein55 Newsletter No 026 - image - China

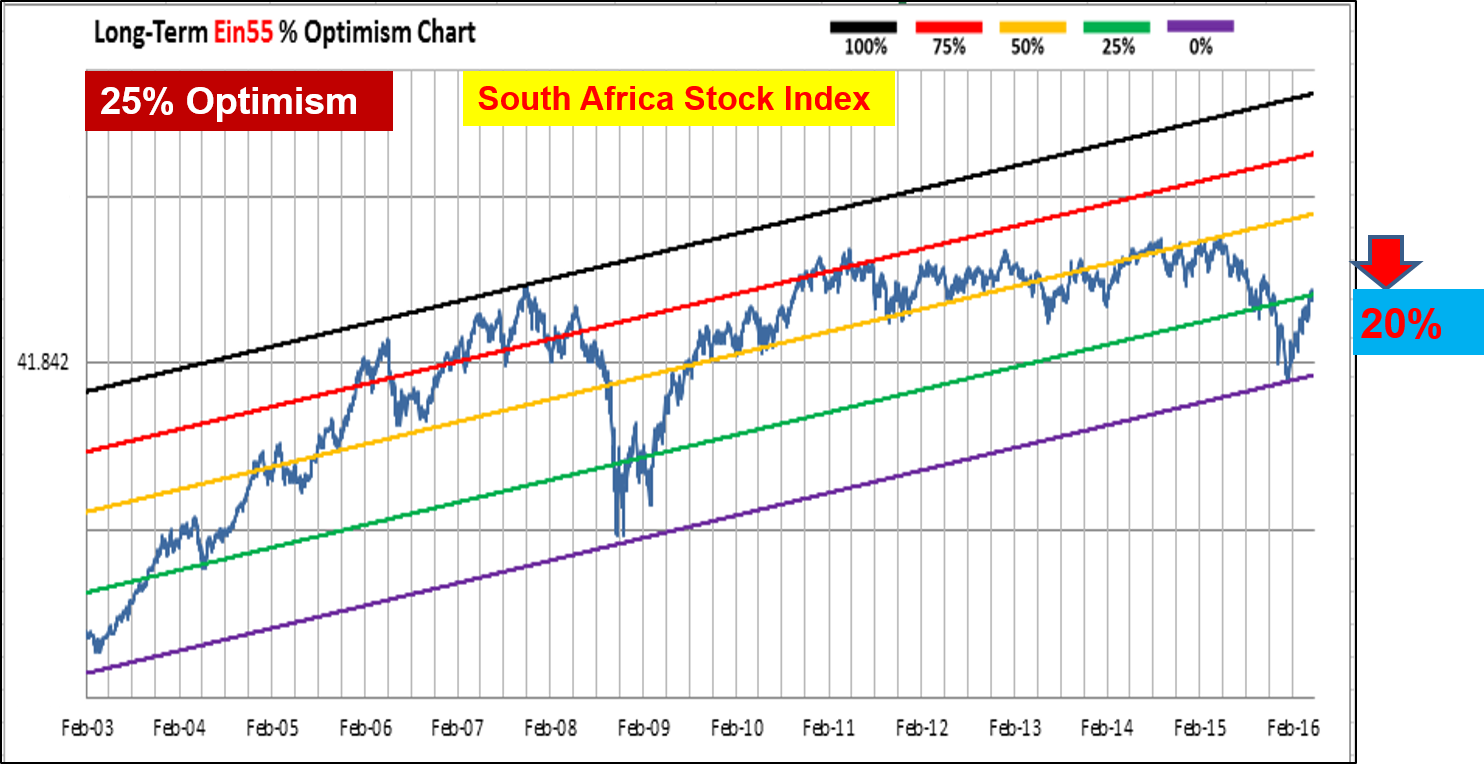
South Africa is relatively smaller in economy size, Optimism now is at ideal 25% Optimism with only 20% correction in stock market (see chart below).

Ein55 Newsletter No 026 - image - South Africa

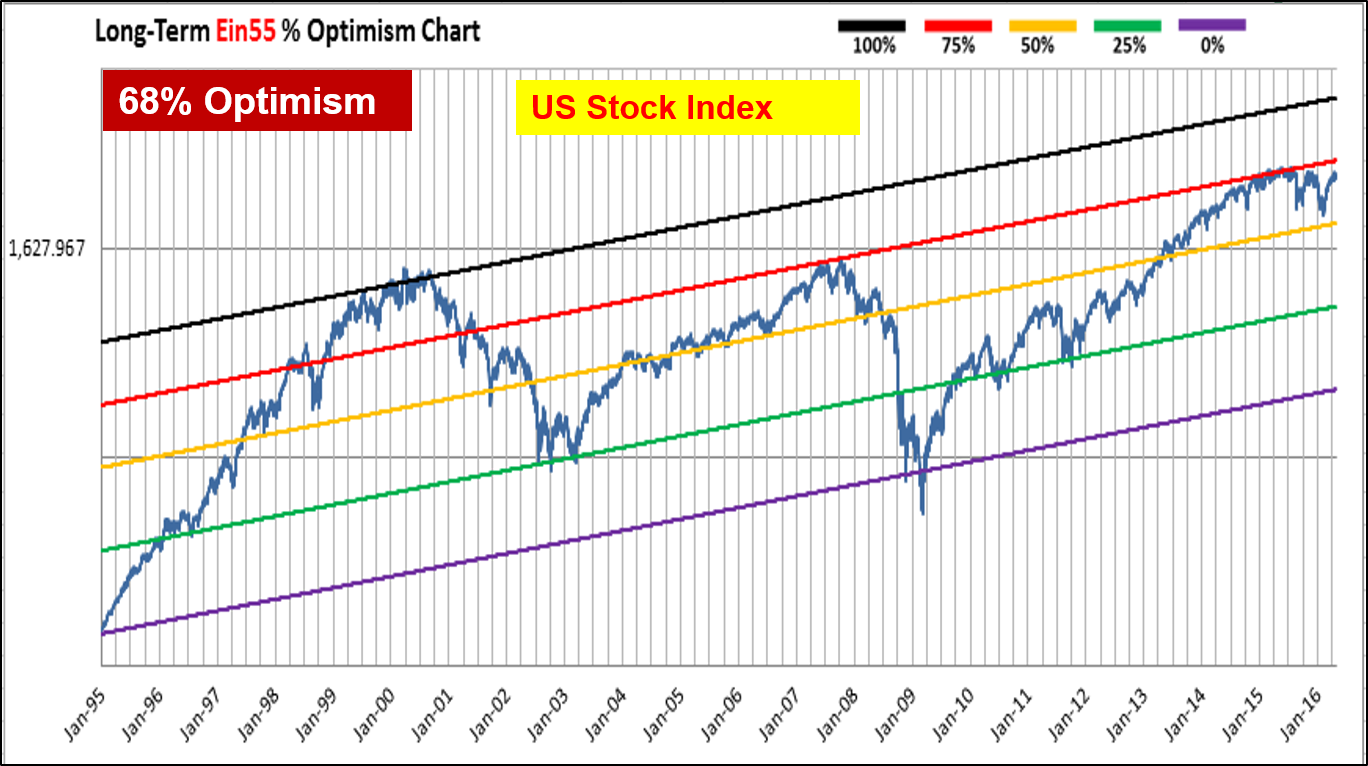
The level-3 crisis and opportunity mentioned above requires longer investing strategy because global economy recovery is a gradual and longer term. Political economy is also crucial for the recovery of stock markets.  BRICS have to compete with US which is now at moderate high Optimism of 68% (see chart below) with more bullish economy, challenging the next historical peak in stock prices.

Ein55 Newsletter No 026 - image - US

If there is still a last global rally in stocks, BRICS may recover strongly with US stock market may rise to new historical high.  Other smaller emerging countries stock markets (eg. Southeast Asia) and many individual stocks may follow BRICS as well. However, after the next bull run, there could be another perfect storm waiting ahead, level 4 global financial crisis may severely injured all the global stock markets, both US and emerging counties. The ability to know when to sell to take profit will be crucial.


Fresh from Oven – Download eBook by Dr Tee: Global Market Outlook 2016

Ebook Cover 2016

I have just finished writing the eBook on Global Market Outlook 2016.  You may download from this link:
https://www.ein55.com/free-public-education-on-investment-programs-by-dr-tee/

Please feel free to forward the latest eBook 2016 to friends. You and your friends are also invited to attend the workshop on Market Outlook 2016, next 2 dates will be on Nov 26 and Dec 20. See below for details of registration.

====================================
Table of Contents
1.  Mass Market Sentiment Survey
2.  Review of 2015 Global Markets
3.  US Market Outlook
3.1  US Government Debt Limit
3.2  Tapering of QE3
3.3  Fed Interest Rate Hike
3.4  US Job Market
3.5  US Property Market
3.6  US Bond Market
3.7  US Dollar vs Commodity (Gold / Silver / Crude Oil)
4.  Regional Market Outlook
4.1  Europe Market
4.2  China Market
4.3  Hong Kong Market
5.  Singapore Market Outlook
5.1  Singapore Stock Market
5.2  Singapore Property Market
6.  Conclusions and Recommendations


Global Stock Market Crash?

Ein55 Newsletter No 017 - image - Market Crash

Global stock markets of 4 major economy: US, China, Japan and Germany have achieved 75% optimism. Therefore, it is not a surprise to see major correction in the past 1 month. We should follow Optimism from Level 1 (individual stock) to Level 2 (sector) to Level 3 (country/region) to Level 4 (world).

Although Singapore STI and Hong Kong HSI have been only 50+% optimism in the past few years, they are smaller market, we need to follow a bigger market to evaluate our probability of success with Optimism. High optimism = high risk, 75% World Optimism means the chances of falling down is 75% while there are only 25% chance to go up. Don’t over-trade or over-invest, keep at least 75% cash as world Optimism has reached 75% optimism. If we follow the rule of money management, taking profit with higher optimism, the risk could be minimized.

For those who want to grab on the opportunity of falling giants of global stock markets, adding Technical Analysis (TA) will be helpful because the falling knife could be severe, your personality may not be suitable to buy low with downtrend. Regardless it is a major correction (mid-term) or Level-4 (world) crisis at longer term, we should consistent to buy low (either long term, mid term or short term) and sell high later. If we could diversify over 10 different giants (through Fundamental Analysis, FA), even if the giants fall down, the chances of recovery is very high especially if the price correction is mainly due to the human greeds and fears (Personal Analysis, PA), not the FA (economy or company business performance).

TA = FA + PA

 (Share price is a reflection of business performance and traders emotions)

We shall continue to apply this FTP (FA + TA + PA) analysis around the Optimism Strategy to profit from the global stock market in a safe way. There is no need to guess the direction of the market, low enough, we could enter; high enough, we will exit. The low and high shall follow our personality for short term trading, mid term trading or long term investing. New Level-3 giants are falling down (eg. Malaysia, both stock and currency markets), grab on the opportunity to time yourself with consideration of Level 1-4 Optimism.


Global Market Rally from Bullish Years of Horse to Sheep

As pointed out in my article 1 year ago, a stumbling Year of Horse 2014 is indeed a blessing in disguise.

https://www.ein55.com/2014/02/stumbling-year-of-horse-a-blessing-in-disguise/

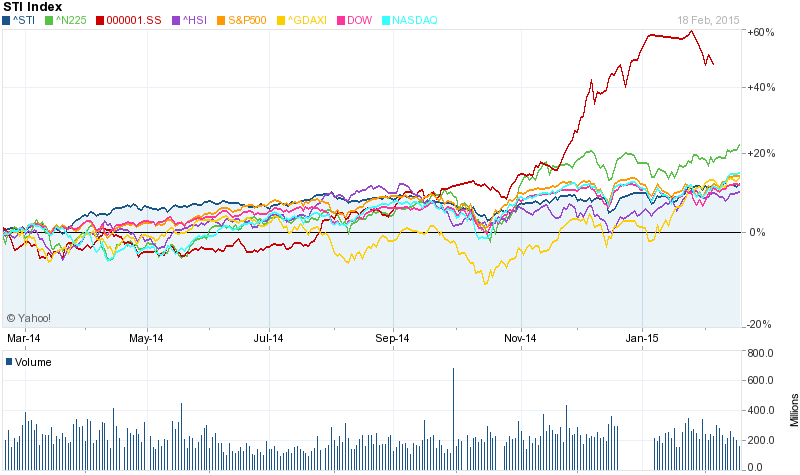
Year of Horse had a rough start but having a nice yearly performance as predicted 1 year ago. All the major global stock indices show positive yearly return, ranging from 10% to 50% gains (see graph below), despite uncertain stock market conditions at that time with gloomy QE3 tapering and China economy slowdown.  As predicted, China Shanghai Stock Index (can be traded with A50 ETF) at 2000 points was a strong support as few country indices with strong fundamentals could have such a low optimism.  Final results show that China Shanghai Index has experienced 70% rally from 2000 points to 3400 points, Ein55 market optimism strategy has successfully predicted this golden opportunity.

In addition, Temasek Portfolio with undervalued low-optimism have recovered successfully, eg, SMRT ($1 to $1.80), NOL (recovering from price valley), Capitaland ($3 to $3.60), there are many more “Temasek Giants” are waiting for recovery:

http://www.temasek.com.sg/portfolio/portfolio_highlights/majorportfoliocompanies

My investing philosophy is to look for investment giants, patiently waiting for the giants to fall down, helping the giants to get up, finally saying goodbye to the giants who will then reward us substantially for the help given. Learn how to position yourself to benefit from the stock market recovery, there are many falling giants from various sectors (oil & gas, retail sales, casino, palm oil, mining, etc) in many countries who are waiting for recovery.

Similarly in the Year of Sheep 2015, the stock market is again uncertain with predictable US interest rate hike, bearish global commodity market (including oil crisis), gloomy European market due to Greece deadlock and massive ECB quantitative easing.  Risks are opportunities in Year of Sheep.  In a bullish market, every risk will result in market correction, which can be a safe entry point.

To better understand the risk and opportunity in Year of Sheep 2015 for stocks and properties, you and your friends may attend my next free investment workshop (both English & Chinese versions are available, solid 3hr knowledge sharing), register through the link below:

https://www.ein55.com/free-public-education-on-investment-programs-by-dr-tee/

Wish all the readers a successful investment in the Year of Sheep 2015!

Ein55 Newsletter No 013 - image - Year of Horse Performance


全球投资市场:万马奔腾至三羊开泰

在一年前的马年市场展望报告,我准确地指出,马失前蹄乃塞翁失马、焉知非福。

https://www.ein55.com/2014/02/stumbling-year-of-horse-a-blessing-in-disguise/

马年开市不利,不过后劲十足,就如我所预言一年前。所有主要全球股票指数,全年正数回报,获利介于10%至50%(看以上图表),纵然当时QE3乌云密布,中国经济缓慢。正如所料,中国上证指数(以A50 ETF交易)于2000点是强有力的支撑,因为鲜有强国处于如此低乐观指数。结果,上证指数经历了70%的飞腾,从2000点回弹至3400点,Ein55市场乐观指数策略成功地预测了这个良机。

除此之外,被低估的低乐观指数之淡马锡投资组合已经成功恢复,例如SMRT ($1 至 $1.80), NOL (从谷底翻上), Capitaland ($3 至 $3.60),还有更多的“淡马锡巨人”正在康复中。

http://www.temasek.com.sg/portfolio/portfolio_highlights/majorportfoliocompanies

我的投资理念是寻找投资巨头,耐心等待巨人倒下,然后帮助他东山再起,巨人将感恩图报。

学习如何定位自己,从股市复苏中受益,静待许多国家的各行业(石油/天然气、零售、博彩、棕榈油、矿物等)的重挫巨人再崛起。

同样地,在2015羊年,股市也是不稳定,包括可预测的美国加息,全球商品市场低迷(包括原油危机),阴郁的欧洲市场(希腊僵局、欧洲央行大规模量化宽松政策)。每个风险是羊年的良机。牛市中,每个风险会导致市场调整,恰也是一个安全的入市点。

为了更好地理解2015羊年股票和房地产的风险和良机,您与朋友们可以参加我的下一个免费投资研讨会(可选择英文或华文版,3小时充实的知识分享),通过下面的链接进行注册:

https://www.ein55.com/free-public-education-on-investment-programs-by-dr-tee/

祝贺所有读者一个成功的投资年,羊羊得益!


Risks are Opportunities in the Year of Sheep 2015: China Market Rally and Crude Oil Crisis

Happy New Year to all readers.  Here are some new updates on current market outlook (supplements to eBook on Global Market Outlook 2015) when we welcome the Year of Sheep 2015.

1) China Market Rally

As shared in several workshops and publications since 1 year ago, 2000 points was a golden entry point for China SSEC Index (through A50 ETF) as it was at 25% Optimism, a rare opportunity for a major country index to be corrected.  Indeed, in the past few months, after the Shanghai and Hong Kong stock markets are connected, it provides a reason for the traders and investors to push up the undervalued SSEC Index to 3330, appreciation by 65%!

Although SSEC or A50 still has more than 50% growing potential (before reaching 75% Optimism), a safer  strategy now could be looking for individual undervalued stocks with low optimism (<25%) which are still lagging but having more potential to rise.

2) Oil & Gas Correction

Brent crude oil price has been dropping in the past few months, from US$115/barrel to the lowest of US$47/barrel recently.  Global commodity price index has been below 25% Optimism when crude oil was still above US$100, the unstable high oil price at over 75% Optimism was triggered by a complex interactions of:

2.1) Recovery of US:

The US dollar is strengthened after QE3 is fully tapered since Oct 2014, following by anticipation of US interest rate hike in 2015. USD and commodity (eg. gold, oil, etc) usually move in opposite direction.  With US unemployment rate drops to 5.6% in Dec 2014, the US recovery will continue in the next few years, oil will be under pressure.

2.2) Political Economy

There could be political considerations for oil producer vs oil consumer countries, OPEC and non-OPEC countries, conventional vs shale oil technology.  The demand vs supply principle of economy is disturbed, resulting in high volatility in oil prices.  The crude oil price is halved, the impact is as if a new form of global QE (Quantitative Easing) to stimulate the economy because the energy cost is lowered, there is more saving for spending or investing in near future, at the expense of oil producers who have accumulated significant reserves of wealth during the super bull run of oil from 1999 to 2014.

2.3) Trader Psychology

Profit taking or cut loss when prices drop from high point, resulting in falling-knife trend, few traders dare to catch to support the price.  With more hedging and shorting sentiments, the oil price will be under correction, following the old foot step of gold prices a few years ago.

A crisis is usually an opportunity, a blessing in disguise. Oil price has resulted corrections in many stocks in Oil & Gas, some are below 25% or even 0% Optimism, which usually only observed during Global Financial Crisis, not in the middle of a bull market. Commodity has a much longer market cycle (eg. 20-30 years), may not be aligned with economy cycle. Each investment market (stocks, properties, forex, bonds, etc) has different investment clock, % Optimism strategy could be applied to buy low sell high.  For long term Brent crude oil, 0% Optimism is at US$44/barrel, over-correction by the market will provide an excellent opportunity to both traders and investors but a proper strategy must be adopted, especially to overcome the market emotional swing due to short term volatility.  The timing of crude oil recovery then will be the timing for oil & gas related stocks.

The sector correction will be rotated from time to time among various industries due to imperfect market, following the Optimism level, higher one will have higher risk, lower one will have higher potential.  The oil correction will help the shipping sector (eg. NOL, SIA, etc) at low optimism to grow, higher outlook for profitability with lower energy cost.  The rally in China market will help the Singapore S-chips to recover gradually, especially after the China economy is improved further. The last example was severe Singapore REITS correction in year 2013 after 50% rally, now in recovery phase but will have limited upside due to increasing mortgage rate (anticipation of US interest hike) and gloomy outlook of Singapore property market.  Earlier example was storm in penny stocks, correcting many stocks, resulting in low trading volume due to negative sentiments.  Based on the survival of the fittest, each correction will make the “giants” or strong-fundamental stocks become stronger after recovery from the valley of lower price.  We want to look for giants who are falling down, helping them to recover at the right time, then the giants will reward us when becoming strong.

For those who are interested in the details of market outlook 2015 or Ein55 styles with Optimism Strategies, you may drop by to attend the next free workshops conducted by Dr Tee.  All the best to all in trading and investing for year 2015!

eBook on Global Market Outlook 2015

It is fresh from the oven:   I have just finalized 35-pages eBook on Global Market Outlook 2015. You could download here:

Existing Newsletter subscribers: Please refer to the download link sent by email on 14 Nov 2014

Non-newsletter subscribers: Please sign up (click on eBook image of ein55.com) before download

Aligning with the introduction of new eBook, I have prepared 3 exciting free workshop and short course (total worth $1000) in Nov & Dec 2014 for the readers:

1) Global Stock Market Outlook 2015

2) Best Timing to Profit from Singapore Property Market and REITS Stocks

3) Market Optimism Strategy with Integrated Fundamental and Technical Analysis


Free seats are limited (first come first served), please register through:

https://www.ein55.com/free-public-education-on-investment-programs-by-dr-tee/


eBook Table of Contents (Global Market Outlook 2015)

1.  Mass Market Sentiment Survey

2.  Review of 2014 Global Markets

3.  US Economy and Market Outlook

3.1  US Government Debt Limit

3.2  Tapering of QE3

3.3  Fed Interest Rate Hike

3.4  US Job Market

3.5  US Property Market

3.6  US Bond Market

3.7  US Dollar, Inflation & Gold / Silver / Crude Oil

4.  Regional Economy and Market Outlook

4.1  Europe Market

4.2  China Market

4.3  Hong Kong Market

4.4  Japan Market

4.5  Southeast Asia Market

5.  Singapore Economy and Market Outlook

5.1  Singapore Stock Market

5.2  Singapore Property Market

6.  Stock Market Potential for 2015 and Beyond

7.  Conclusions and Recommendations

Acknowledgements

Appendix


Preludes to Peak of Stock Market: QE3 Tapering & Fed Interest Rate Hike

Ein55 Newsletter No 006 - image - QE & Interest Rate HikeThe current bullish global stock market since Mar 2009 has been 5 years as of now (Mar 2014), comparable with the maximum 5 years duration of bull market in the last market cycle (Dow Jones Index from valley of Oct 2002 till Oct 2007).  It is likely for the current market cycle to be much longer than the previous ones because there are major corrections along the way, limiting the increase in % market optimism, therefore lower risk in reversal into a mega bear market.

In the last Global Financial Crisis in 2009, the world #1 economy, US, adopted extraordinary measures of Quantitative Easing (QE1, QE2, QE3) and near-zero interest rate by the Fed.  As a result, the US and global markets were artificially recovered, forming the phase1 of bull market in the initial first 2 years.  However, the double-edge sword of QEs made the global market pay for the advance credits during the QE tapering process, resulting in a few rounds of market corrections, together with other regional financial crisis.  At the same time, the global economy (US, Europe, Asia) recovers gradually, in a more natural way to support the global stock market.

At this junction, before the peak of stock market or economy may be reached, QE3 must be tapered and completely stopped, so that a more natural market cycle can be formed.  Either introduction of QE during a bearish market or tapering of QE during a bullish market, gives confidence to the global investors. The Fed has done a good job to pre-alert the global investors with a few rounds of fire drills last year on the possible timeline of QE3 tapering.  The market reacted fearfully initially, then it becomes a norm, most investors are able to “predict” $10 billion per month of QE3 tapering after each FOMC meeting by the Fed.  Meanwhile, the US economy recovery was accelerated, approaching the psychological checkpoint of 6.5% unemployment rate while the inflation rate is still well below the critical 2.5%.

With the initial success in QE3 tapering, now the Fed hopes to apply the same strategy to alert the global market on timing of interest rate hike (investors like a predictable market).  After a few rounds of pre-conditioning in near future, global investors are likely to accept the fact that interest rate has to go up from the valley.  Besides, the Fed hopes to buy more time for change in bullish market sentiment, modifying the earlier criteria of 6.5% US unemployment rate and 2.5% inflation rate, to a larger group of economic indicators, to ensure a more sustainable and stronger sign of economy growth.

After QE3 is fully stopped (estimated in year 2014 if there is no surprise to the market), the Fed is expected to increase the interest rate in about 6 months later.  The Fed interest rate will chase after the 10-year US Treasury Bond yield, likely will take about 3-5 years (average of about 1%/year, depending on economic conditions) to catch up and even exceed the critical rate of 4%, when the peak of economy may start to form.

If the global stock markets continue to grow in a bumpy way with market corrections from time to time, the condition for market fever with >75% optimism may not be ready, then it is possible to have a super long (over 7-10 years) but gradual growth bull market.  It is critical for investors to position themselves with visibility of at least next 3 years, applying the preferred market strategy.