Dr Tee 免费华语视频投资课程: 环球股票市场展望与冠状病毒技术分析

危机,有危就有机。Dr Tee 应用了难得休假,制作更多网上学习课程。几天的努力后,呈献给 Ein55 会员,全新的免费华语视频投资课程(一小时多的学习):环球股票市场展望与冠状病毒技术分析。

这儿是 Dr Tee 华语视频 (英语视频也已完成,Dr Tee 双语皆行):  https://youtu.be/Wxq_6lj_mOE

请欣赏鄙作,留言求进步。您可订阅 Ein55 youtube 频道,链接未来投资视频。双红利:

1) Dr Tee 9堂网上价值投资策略课程 ($100, Ein55 会员获得75%折扣,只需$25, 可全家分享):
https://www.investingnote.com/store/products/discover-giant-stocks-value-investing-strategies

2) Dr Tee 免费投资课程与电子书下载:
www.ein55.com

Singapore Budget 2020 vs Coronavirus (Updated 19 Feb 2020)

Singapore Budget 2020 Coronavirus

Singapore Budget 2020 is just announced, a balanced plan with both short term (eg. fighting Coronavirus crisis) and mid/long term (eg. retraining) goals. However, money is never enough, so the incentives is just a temporary relief. A country could only get stronger with higher productivity in higher value economy sectors.

Additional financial assistance is given to 5 main sectors affected by Coronavirus, eg. tourism, airline/cruise, transportation, F&B and retail, some business may have dropped more than 50% over the past 1 month.

Fear of Coronavirus is more harmful than its real risk (# death, so far 0 in Singapore) as people start to stay more at home, the sectors above would badly affected. However, this health crisis is likely to be a short term for a few months. Even it becomes an uncontrollable disease as seasonal flu, the fatality would drop significantly based on past experience of new viruses (eg. H1N1) due to build up of immune system within human with more infection. Human could “evolve” as well together with viruses, both have to co-exist in a balanced way of living.

Singapore Coronavirus

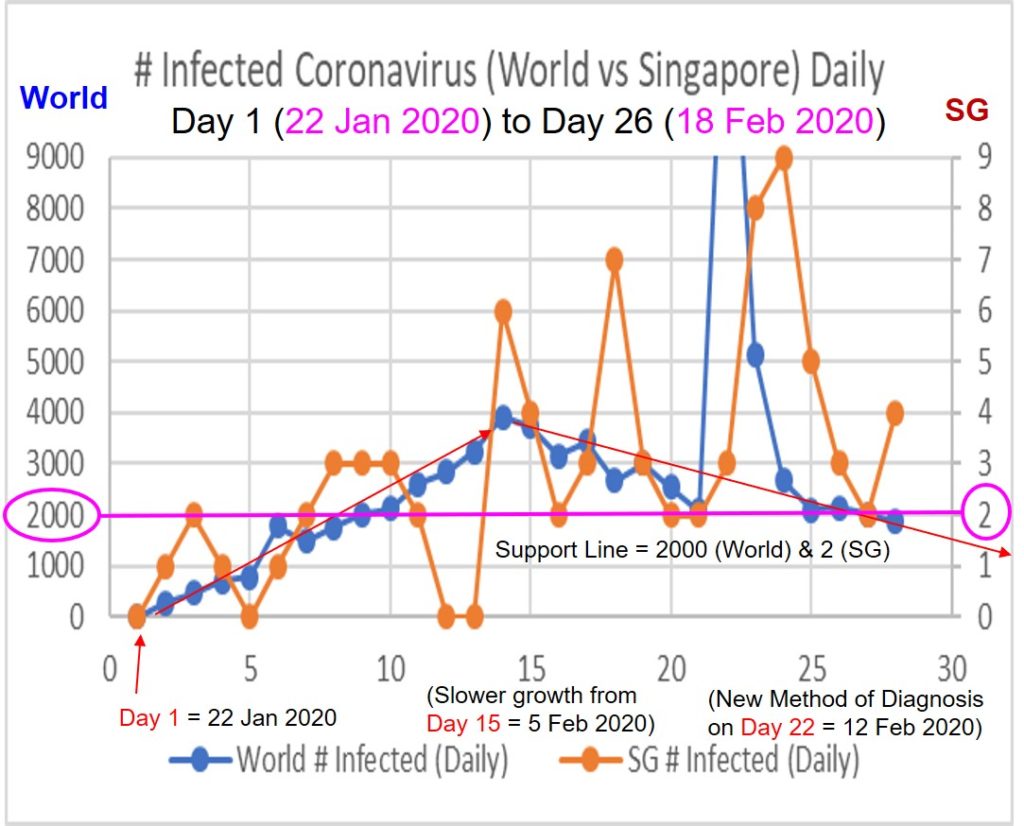
Based on the latest daily # infected for Coronavirus, World (mainly China) is falling down below the critical 2000 “support” from Technical Analysis point of view, light at the end of tunnel to see a strong bearish signal with strong hope to reach a peak (not absolute peak but 95-99% of ultimate value) by end of Feb 2020, with conditions that data reported so is reliable and consistent without a second wave of infection (workforce back to work after lunar new year).

Singapore is still staying above the “support” of 2 daily cases, no clear signal of downtrend in # infected cases. However, the consistent downtrend in World (mainly China) cases is a strong lead to Singapore which is likely 1+ month behind China.

Even after reaching peak, Coronavirus may take a few months to end as there may be cross-infection of those waiting for recovery and long incubation period (14 days).

Learn to take action in stock market before Coronavirus may end in near future: www.ein55.com

Dr Tee Investment Course (Stock, Property, Commodity, Forex, Bond)

Grandparents Bank Stock – HSBC (HKEX: 0005)

HSBC Bank Stock

Despite HSBC (HKEX: 0005) is not a giant bank stock, it is definitely not a junk stock. It used to be a giant stock several decades ago but declining over the last decade in both business and stock prices. So, for life-time investing strategy, it is important to review the grandparents blue chips (another example is SPH, SGX: T29), at least once a year, if business moves in wrong direction (downtrend instead of uptrend) year after year, a painful early farewell may be required, not to wait until falling in share prices over 50%, be a lifetime investor unwillingly, resulting in more capital losses through long term investing of a declining business.

HSBC is still the largest bank in Europe and Hong Kong but we may not need to buy the largest bank. Instead, we focus in most value for money giant bank stock for investing (many in Asia countries, eg Hong Kong / China, Malaysia, etc), selecting the strongest momentum bank stock for trading (probably in US).

HSBC is not a giant bank stock (big size but not strong fundamentally). Global financial crisis has not come, weaker business already catch the cold (start to layoff staff recently), not sure if could survive in the next cold winter with intense global competition.

Investors may also compare with 3 major banks of Singapore: DBS Bank (SGX: D05), OCBC Bank (SGX: O39) and UOB Bank (SGX: U11) which require different investing strategies.

Learn from Dr Tee invest in local and global giant stocks (bank, property, REIT, F&B, healthcare, technology, oil & gas, etc) from Free 4hr stock investment course. Register Here: www.ein55.com

Dr Tee Investment Course (Stock, Property, Commodity, Forex, Bond)

Technical Analysis with Level 1-4 Analysis for Coronavirus (Updated 17 Feb 2020) with Singapore Budget 2020

Coronavirus Singapore Budget 2020

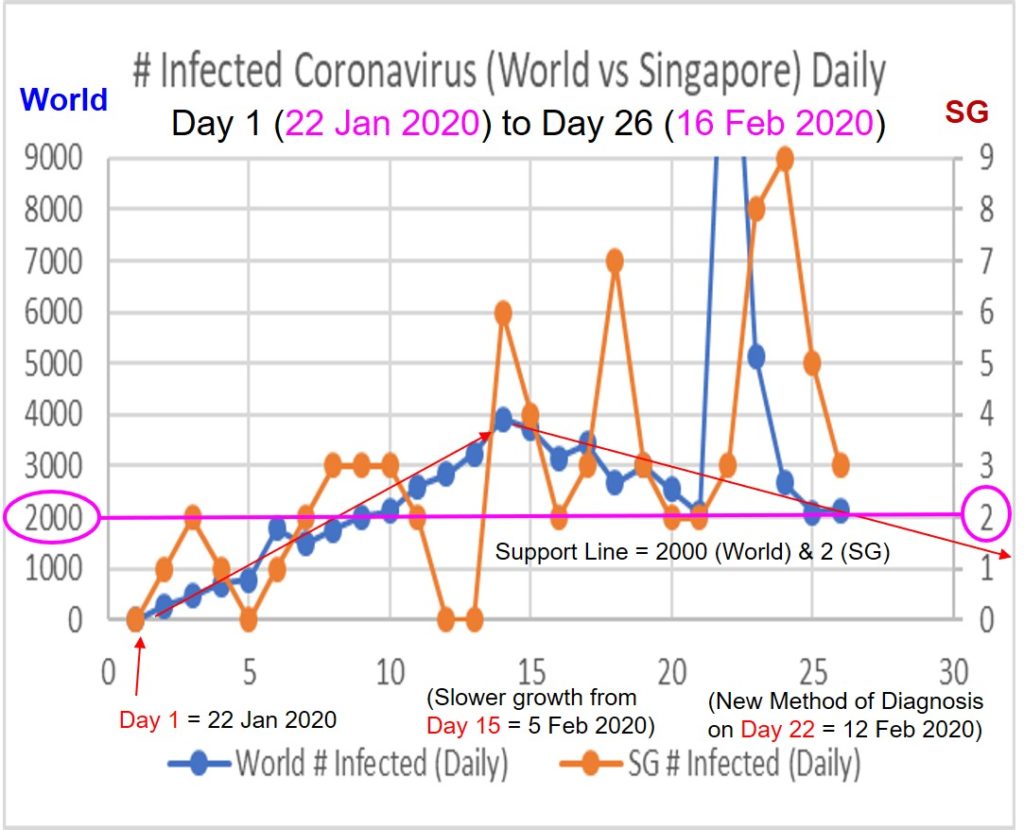
Similar to Technical Analysis for stock market, we may analyze the # infected cases as share prices but looking for bearish signal, eg downtrend or breaking below a critical support, eg 2000 cases for World (mainly China Hubei) or 2 cases for Singapore.

Latest Coronavirus data (16 Feb 2020) has 3 cases of # infected in Singapore, having good chance to come to “technical support” of 2 daily cases again but need to break below this number for a few days or even 1 week to establish a consistent downtrend. It is harder to analyze Singapore cases due to limited sample size (similar to a volatile penny stock, when base is a low number, up/down would create large % changes).

So, it is relatively more stable to analyze world # infected cases (still near to support of 2000 daily new cases but not yet breaking downward) which are more stable due to large sample size (so far consistently about 1000 times of # cases in Singapore). The mega trend of world could provide some leads to direction of Singapore cases in future.

For stock analysis, this is similar to Level Analysis (LA) or LOFTP strategies, Top-down analysis from World (Level 4) to Country (Level 3) to Sector (Level 2) to Individual Stock (Level 1). For Coronavirus:
Level 4 = World # infected
Level 3 = Respective Country # infected
Level 2 = Respective City # Infected (Singapore L2 = L3 due to small country = city)
Level 1 = Cluster / Group / Company of related cases (smallest unit to track # infected cases).
==========================================
Singapore Budget 2020 to be announced on 18 Feb 2020, ideally will serve multiple objectives for 3 different time frames (similar to stock investment: short term, mid term and long term):

1) Short-term (< 3 months): Coronavirus induced financial crisis, especially selected sectors.
2) Mid-term (<1 year): Stimulate Singapore economy which has been slowing down (even before Coronavirus outbreak)
3) Long-term (5-10 years): Create new opportunity for Singapore (restructuring of economy, training / investment in emerging technologies with higher economic values, etc)

Of course, politically, this would give 4th generation leaders, a chance to take the lead, making major decisions during potential crisis time. The results in short term, mid term and long term would translate into scores for voters to consider before next General Election, within 1+ year (latest by 15 Apr 2021). Balance in consideration for short term, mid term and long term would be a test on wisdom of leaders, whether to satisfy short term crisis needs or looking for long term growth or a balanced or average approach with sharing of resources to make most people satisfied but not excited.

Crisis could be an opportunity if the crisis could be resolved eventually with right decisions most of the time. It is true for all countries leaders, especially those most affected by the current Coronavirus: China, Singapore, Japan, Hong Kong, etc.
Learn the opportunity in stock market while waiting for recovery of Coronavirus Crisis: www.ein55.com

Dr Tee Investment Course (Stock, Property, Commodity, Forex, Bond)

Good News and Bad News of Coronavirus vs Stock Market (Updated 16 Feb 2020)

Good and Bad News of Coronavirus

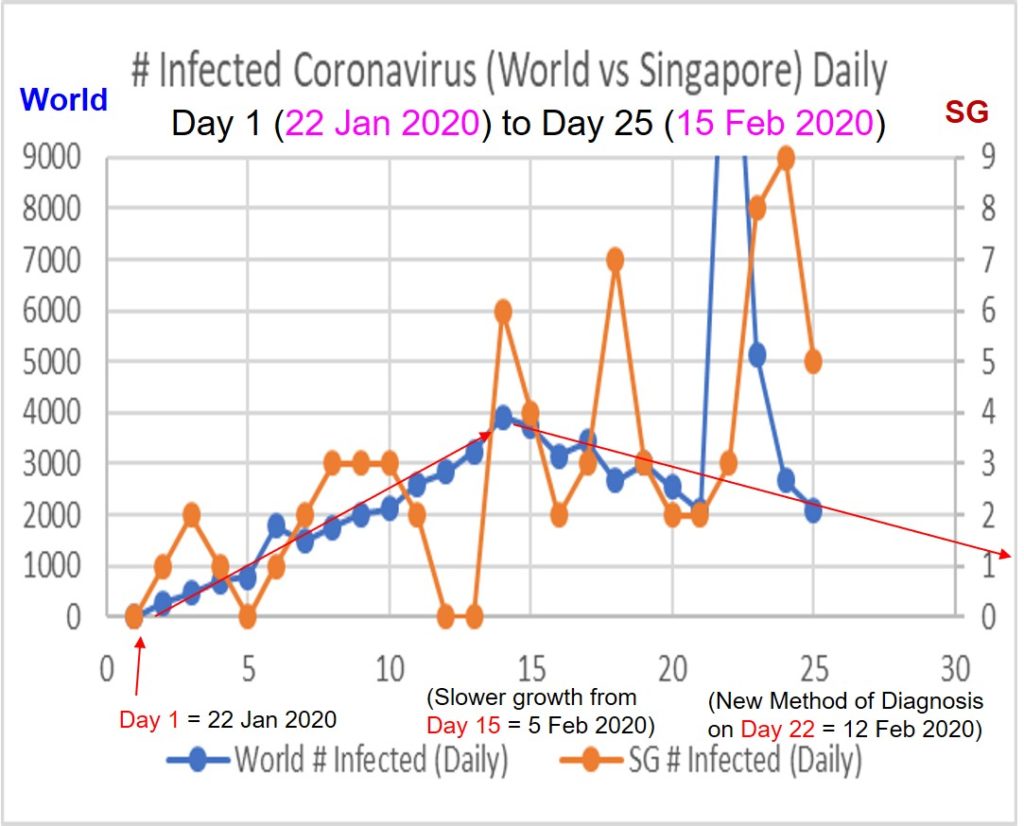
After China Hubei applied New Method of diagnosis, # cases on 12 Feb 2020 (Day 22 on chart given since monitoring from 22 Jan 2020) surged to an unbelievable number. As pointed earlier, there was no major change in actual condition, the dramatic daily difference is mainly due to one-time adjustment due to new method. However, it disturbed the earlier analysis (was downtrend nicely in # infected cases for 1 week from 15 Feb to 21 Feb 2020), therefore we need to reestablish the confidence in trend with more days of further monitoring.

Good News:

1) Based on last 3 days with New Method of diagnosis in China Hubei, the relative trend is down, implying the absolute # infected could be still a myth but more importantly the downtrend is hopeful, either using Old Method (1 week data) or New Method (3 days data).

2) In fact, the # infected cases old New Method has approached the Old Method of about 2000 daily cases, therefore it is possible to integrate both New and Old Method together but the projected peak for World (mainly for China Hubei) is extended by about 1 week from earlier 22 Feb 2020 forecast to end of Feb 2020.

China Hubei is the original source of Coronavirus started around Dec 2019, if new cases could be limited to very few (peak = 95-99% peak, may not be 0 case, there will be still a few cases each day), possible cross infection to other China cities and also to other countries will be limited. It means, each country or city, just need to focus in own measures to limit the internal spreading of Coronavirus, less worry of external import of # infected cases (eg. cruise, airline, etc).

Bad News:

1) The Good News above is based on the assumption that the reported data is true (at least within the criteria used, either Old Method or New Method) and there is no second wave of infection (eg. China Hubei may stop locked down of city when peak is reached by end of Feb, work force back to work or travel to other cities could create second surge, just need a few super spreaders to ignite the fire again).

2) There is clear divergence in growth rate between China Hubei and other cities or countries (eg. Japan, Singapore, etc). This is logical as the first case in China probably started in Dec 2019, possible to reach a peak by end of Feb 2020 (if there is no second wave) but other countries mostly have first import case from Hubei in Jan 2020 (eg. Singapore first confirmed case was 23 Jan 2020), therefore there is a time delay of about 1+ month. So, even China may have reached the peak by end of Feb 2020 (proven by slower growth rate), the high growth phase still continue in other cities and countries, therefore may take another 1+ month.

It means China is leading, both the starting, growing, slowing and ending of this Coronavirus crisis. Despite we are in Singapore or another country, monitoring of China trends would still help us to better estimate own condition.

=========================

There is a surge in # infected cases over the past 1 week in Singapore, still under high growth rate. This is similar to Technical Analysis of stock for Coronavirus: higher high and higher low with support around 2 cases. It means Singapore has to achieve lower high and also breaking support of daily cases of 2 (eg. 0 or 1) to see the first reversal signal from higher to slower growth rate.

At the moment, Coronavirus is still a mini black swan, stock market has digested the initial fear. However, it is important to monitor the development, see if mini bear could become a big bear eventually.

Under the worst case, even Coronavirus is beyond control (eg. after either locked down of cities or countries in China or Red Dorscon Alert in Singapore with no people going for work or school for a period of time), likely will become a stronger version of H1N1 which is wide spreading yearly, living in “harmony” without great fear by human, despite it is causing tens of thousands of death yearly since 2009 outbreak (even till today under “Flu Type A”) but when people hear it is flu, fear would drop due to its low fatality of 0.05%, ignoring it is wide spreading.

Coronavirus is like a hybrid of SARS and flu: more contagious than SARS but spreading less than seasonal flu; less deadly compared to SARS but more severe than common flu around. Coronavirus would continue to evolve, when more people in the world are infected, fatality would drop due to stronger immunity developed through joint effort of human (despite vaccine may or may not be available).

In short, we need to stay calm, do the right things each day, as normal as possible, life still need to go on with viruses around.

After free oneself from fear of Coronavirus (either defeat it or accept it), don’t forget to learn about investment, converting the current health crisis into new investment opportunity.

Learn Here with Free 4hr investment course by Dr Tee: www.ein55.com

Dr Tee Investment Course (Stock, Property, Commodity, Forex, Bond)

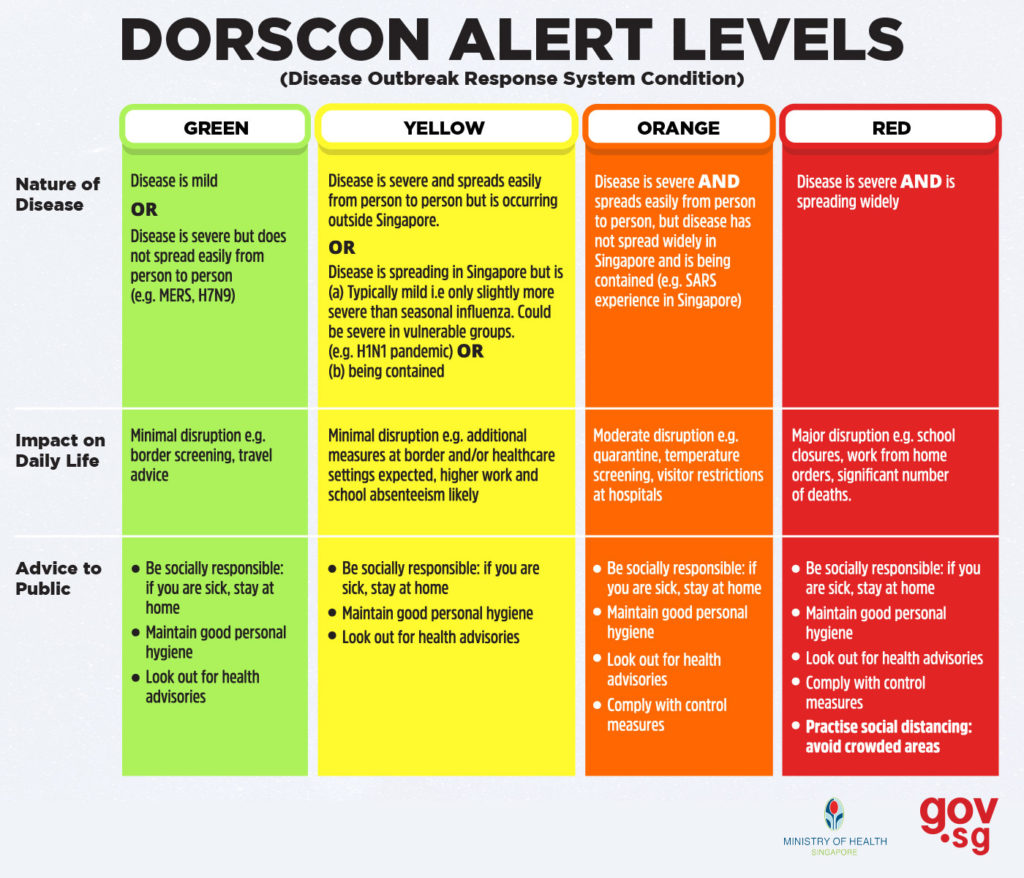
Dorscon Alerts with 4 Levels of Investment Opportunities

dorscon coronavirus investment

Dorscon disease outbreak alert system (4 colors: Green, Yellow, Orange, Red) was established in Singapore after SARS 2003. Some people may worry the current situation may be changed from Orange to Red Alert for Coronavirus (if so, schools have to be shutdown temporary).

There is grey area (no clear quantitative criteria) in Dorscon for 2 main criteria (# infected vs # death) to be Red Alert:

1) spread widely

– how many # infected daily is considered widely

2) Significant # death

– how to define significant?

Even for SARS in Singapore, it was later benchmark as Orange Alert, having 33 death out of 238 infected cases in Singapore. Since Dorscon absolute criteria may not be known. We may do a relative criteria based on benchmark with known case of SARS in 2003 at Orange Alert.

For Coronavirus, although actual fatality rate could be much lower than 2% (due to many cases in Hubei may not be diagnosed in earlier stage), we may assume 2% as the worst case scenario.

We could do a reversed calculation to estimate when Coronavirus may be as severe as SARS based on Dorscon criteria of Orange Alert before transition to Red Alert. There are 3 possible conditions as criteria:

1) Same # infected as SARS of 238 cases. Currently Coronavirus has 58 # infected in Singapore till 13 Feb 2020. Coronavirus is about 25% level of SARS for Singapore. Since worldwide data shows Coronavirus has more potential than SARS, then this # infected may have potential to grow in Singapore.

2) Same # death as SARS of 33 cases. Currently Coronavirus has 0 death, still a long distance before in par with SARS (which is rated as Orange alert).

3) Since # death in Singapore for Coronavirus is 0, we may also apply same # death as SARS of 33, assuming 2% fatality rate (worst case) for Coronavirus, we could derive a critical # infected = 33/0.02 = 1650 # infected in Singapore before Coronavirus is comparable with SARS. Criteria 2 and 3 are related, see whichever reached first.

Conclusions:

SARS Orange alert criteria is in fact quite high. If we use the same criteria as SARS, then Coronavirus has to have either 238 or 1650 infected cases and/or 33 death in Singapore before declaring the same level of health crisis as SARS (which is still Orange Alert). Based on 3 possible conditions, the easiest criteria (assuming either wide spreading or significant number of death, not both) to meet is probably No 1 based on same # infected of 238. For Conditions No 2 & 3, will be more difficult to achieve, if applying this criteria, likely Coronavirus would remain just Orange Alert.

Assuming SARS is the upper limit of Orange Alert, then Coronavirus currently is probably the lower limit or Orange Alert. The Red Alert has to be reserved for true health crisis, otherwise there is no proper level to reflect the right action for such emergency then.

============================

Dorscon standard is just a reference, main objective is to show the relative risk in health, individual could then use it to make decision on how much risk to take.

Similarly, we may apply 4-color Dorscon concept in stock investment, dividing into 4 levels of investing opportunities, each level has its own risk vs opportunity based on business fundamental vs optimism level:

4 Levels of Ein55 Investment Opportunities

1) Green

– Strong business fundamental

– Low Optimism level (<25%)

2) Yellow

– Strong business fundamental

– Moderate Optimism level (25-75%)

3) Orange

– Moderate business fundamental

– Moderate Optimism level (25-75%)

4) Red

– Moderate business fundamental

– High Optimism level (>75%)

For either long term investing or short term trading, a stock requires minimum of moderate business fundamental. Buying weak fundamental stocks with bullish price trend is speculative, more suitable for very short term trader (eg. during the Coronavirus crisis time, some weak stocks start to rise).

When Optimism level is higher (from Green to Red Opportunity), positioning style is safer from investing to trading. Current global stock market is around Red Opportunity but traders may still consider short term trading in US with high optimism. For Singapore (moderate optimism level), it will be either Yellow or Orange Opportunities, depending on type of stocks.

Learn from Dr Tee free 4hr investment course on balance between risk and opportunities with comprehensive LOFTP Strategies (Level / Optimism / Fundamental / Technical / Personal Analysis). Register Here: www.ein55.com

Dr Tee Investment Course (Stock, Property, Commodity, Forex, Bond)

Financial Report Illusion vs Coronavirus

illusion in financial report

There is about 7X surge (from about 2000 to 14840) in daily new cases of Coronavirus reported today in Hubei of China? No, this is statistical illusion due to different methods.

Old method requires full diagnosis (longer time, more steps) for confirmation. So, it is possible to have many undiagnosed cases which were not reported as confirmed # infected.

New method could confirm # infected after CT scan (faster), therefore number # infected “increased” suddenly overnight.

So, for 14840 “new” cases in Hubei for 12 Feb 2020, we need to divided into 2 methods for consistent comparison:

Old method = 1508
New method = 14840
Difference = 14840 – 1508 = 13332

So, for consistency in reporting, past data should have 2 system, either all old method or all new method (quite unlikely for past data with new method unless they have collected these data but not reported before).

So, it means for future data analysis, we need to add “adjustment” of difference in 2 methods for consistent trend analysis. Eg, 13332 has to be deducted from final 60327 world # infected for 12 Feb 2020, therefore only 46995 case if follow the consistent old method for all data collected so far, therefore only 1825 cases for 12 Feb 2020 (down from with 2071 cases on 11 Feb 2020).

It is important for authority to provide 2 different sets of number or do a one-time adjustment for all data. If not, readers have to analyze data using 2 different timeframes:
Old Method = 22 Jan 2020 to 11 Feb 2020
New Method = 12 Feb 2020 onward

====================

Inconsistent policy or reporting criteria is nightmare for analyst, both for Coronavirus and Financial Market (eg. Stock). In fact, both absolute number (eg. # infected on certain day, earning of company for certain quarter) and relative number (eg. weekly difference of # infected, quarterly or Y-O-Y earning difference of company) are important as they serve different purpose.

Absolute number is to benchmark against certain fixed criteria, eg max # infected for SARS vs Coronavirus, Price to Book ratio of an undervalue company (PB<1) .

Relative number is to show the trend, eg % share prices difference over last 1 week or 1 month during Coronavirus.

Adjustment is everywhere, not a nightmare if we are prepared. Eg, when company has changes in number of shares (stock split or consolidation), the price per share or earning per share can be adjusted accordingly.

The impact of new method in Coronavirus is probably similar to IFRS16 adopted in year 2019 by most countries (except for US, Europe and some countries), resulting in confusion as past financial data (before 2018) could not be adjusted easily, requiring reading financial reports to understand true impact of change.

Similarly, for the sudden surge (1 time) in Coronavirus case today should be viewed as policy change, analyst needs to adjust manually or best with help by authority to provide consistent data (more important than true data). For example, Singapore provide consistent data in # cases for Coronavirus and try its best to cover most cases (may not be all as some have no symptom, infected but not known), therefore reporting higher # infected than other regional countries outside China.

However, current global Coronavirus data of each country can still be trusted because the relative trend is consistent, despite each country may have somewhat different criteria and also effort in diagnosis.

====================

In fact, I have pointed out in earlier post that fatality rate of Hubei is 16 times higher than outside Hubei which is not reasonable. So, this confirms that there a significant reporting difference, resulting in # infected cases reported are less, therefore fatality in Hubei is much higher.
https://www.ein55.com/2020/02/hidden-statistical-analysis-of-coronavirus-with-stock-investment/

Bad News = Ignorant people becomes fearful as “actual” # infected is 7X higher (although could be 14X higher if we use same fatality rate to find hidden data)

Good News = higher # infected confirms the actual fatality rate of Coronavirus should be much lower, the “average” of 2% was based on old method, so if we use simple 2% / 7, actual average fatality could be around 0.3% which is reasonable.

Learn the right way of Technical Analysis in stock investment: www.ein55.com

Dr Tee Investment Course (Stock, Property, Commodity, Forex, Bond)

Impact of Policy Change on Coronavirus Report and Financial Report

financial report policy change

Similar to new rules in financial reporting (eg. IFRS16 on operating lease starting Year 2019), it could have significant change to financial reports but it is one-time adjustment, especially in year 2019. Relative trend after the change should be comparable when an investor compares with 2019 as a new base. IFRS16 makes the analysis more complicated, eg. when Breadtalk (SGX: CTN) shows debt and cashflow are increasing, higher debt could be due to combined factors of actual debt increase and also due to operating lease (change in accounting definition)

So, assuming China government excludes those “no symptom” (despite tested positive) from # infected from Coronavirus definition, we should see a sudden dip on date of policy change, rather than seeing consistent downtrend for 1 week. Of course, if the authority is smart enough to distribute the changes over a period of time, then it is different story.

The worry is not on false downtrend (# infected for last 1 week) due to policy change (possible for 1 day drop, unlikely for entire 1 week drop). The main concern is incubation period of 14 days for those infected before lunar new year (5 millions people travel in/out Wuhan with a population of about 11 millions, Wuhan is heart of China, main junctions for travellers of 9 other China provinces – eg. high speed railways). About 1 out of 3 Wuhan people traveled before Chinese New Year, 23 Jan 2020 (when Wuhan city was locked down) + 2 weeks incubation = 6 Feb 2020 (just nice coincide with slowdown in growth rate of # infected), therefore we see significant downtrend in cases now as infection is mainly within Hubei.

For 5 Millions Wuhan people who traveled out, some have infected other cities in China and also other countries including Singapore, therefore the trends in these countries are still growing as incubation of 14 days is counted from after Chinese New Year. Singapore has banned travelers from China from 1 Feb, therefore we could foresee a downtrend near to or after 14 Feb due to end of incubation period.

However, when people to go back to work after lunar new year break, eg in China (from Feb 10) and in Singapore (from Feb 3), we worry there will be second peak. At the end, these 2 factors will be combined (higher drop due to past isolation measures vs possible increase due to workforce coming back), showing a net result, if -2+1, likely will still show a mild downtrend.

Again, we need to monitor the number of Coronavirus daily, up and down is similar to stock market prices, a combined effect of many factors, not just 1.

There are many principles in financial report and stock market which is applicable in all aspects of life, including Coronavirus analysis. Start to master these investing skills: www.ein55.com

Dr Tee Investment Course (Stock, Property, Commodity, Forex, Bond)

Personality – Are you a Trader or an Investor?

trader investor personality

Unfortunately, mass market emotions are essential for stock market, otherwise it could not move up and down, some people worry more on stagnant market, not greedy (bullish) or fearful (bearish) markets with clear trend. A trader or an investor could leverage on these market emotions for own gains.

So, to position in stocks, No 1 consideration is own personality:
1) Traders – understand the daily up and down sometimes is almost unpredictable as sudden news could change the stock prices within 1 min. Therefore, traders learn to extend the analysis from days to weeks to even months to have an overview with stronger trend. Trend is friend to a trader.

For risk management, traders would limit the max loss of each trade, applying “SET” (Stop loss, Entry Price, Take Profit) in trading plan, execute strictly.

2) Investors – who hardly monitor the market as main objective is to let the money grow by itself through longer term holding. Investors understand that emotions or even “crisis” (eg Coronavirus) could be short term, therefore focusing more in business and financial analysis of companies before investing to ensure a higher winning probability.

For risk management, investors follow diversification over a portfolio of 10-20 global giant stocks. Ideally, align with optimism to buy low during global financial crisis but it is not a must to buy low (great patience is required – 5 or even 10 years of waiting), in fact, buying at fair price is fine but need to focus on stock selection (What to Buy is key).

Learn from Dr Tee free 4 hour stock investment course to understand how to position as a trader vs an investor in the current stock market: www.ein55.com

Dr Tee Investment Course (Stock, Property, Commodity, Forex, Bond)

Dr Tee Video Talk: Coronavirus Life Cycle and Stock Market

Coronavirus Stock Market

Over the past 7 years of teaching with over 700 days of lessons, Dr Tee has not taken 1 single day of MC, working nearly each day. So naturally I feel sad to cancel 12 events in Feb 2020 due to Coronavirus alert by government for wellness of students during this crucial period.

Crisis is Opportunity, I have used the 1 month homestay to learn how to make youtube video talk. After a few days of effort, here is Ein55 Talk for Ein55 Reader on Wuhan Coronavirus Life Cycle with Stock Market Analysis.

Enjoy and give your comments for improvement. You may subscribe to Ein55 youtube channel (Ein Tee) for future Ein55 video talks. You may also attend Dr Tee free investment courses and download free eBooks at www.ein55.com. Join Dr Tee Facebook Investment Forum: https://www.facebook.com/groups/ein55forum/

Here is English Version of Dr Tee Video Talk (Chinese version is available as Dr Tee is bilingual):