Technical Analysis (TA) may be applied in all areas of life, eg stock investment and even on Coronavirus. People likes to know the unknown future, although it is unpredictable in nature to know what may happen tomorrow. If certain assumptions can be made, it is still a reasonable estimation with Technical Trend Analysis but value must be adjusted with each day of new development.
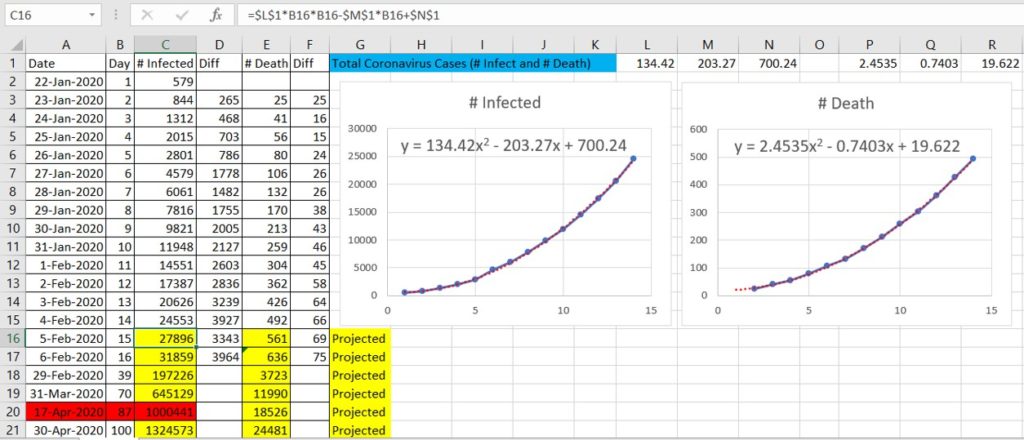
Based on the daily update given by this website, I have tabulated # infected and # death based on global data (mainly is within mainland China):
https://www.worldometers.info/coronavirus/
Trend Analysis is performed, tracking # infected and # death from 22 Jan 2020 (labelled as Day 1) till last reported daily data of 4 Feb 2020 (labelled as Day 14). For daily data from 5 Feb 2020, it is under projection mode as it is still “future” as of now when article is written.
Based on limited data of 14 days, it is observed that second order polynomial equation provides a very nice fit (over 99% correlation) for both # infected and # death:
# Infected = 134.42x^2 – 203.27x + 700.24
# Death = 2.4535x^2 – 0.7403x + 19.622
where x is number of days counted from 22 Jan 2020,
Today (5 Feb 2020) is Day 15, if projected (data highlighted in yellow), there will be over 27896 for # infected and 561 for # death. The difference with actual number could be numerical error and also daily variation (eg. x factors).
This trend analysis assumes the same factors applied, momentum continues each day. If there is no change to this momentum of growth rate, it is projected to reach 1 million # infected by 87 days (17 Apr 2020).
Of course, in the real world, this constant momentum unlikely to happen as this second order polynomial equation implies infinite # infected when # days is very long term. From past experience (eg. with SARS, seasonal flu), we know the growth rate with slowdown at certain time, the second order polynomial equation may eventually reverse in direction after reaching a peak, requiring higher order polynomial or a more complex equation.
Despite limited database, this function is still useful when updated daily for monitoring of growth rate, see if it still follows or deviates from the current momentum. The analysis above is based on total cases, predominantly for mainland China. For the rest of the world (excluding China), condition is much better, similar growth pattern may be observed but fatality rate (# death) is much lower.
With travelling ban among the countries and more local isolation, the growth rate would eventually reach a peak (eg. within Hubei of mainland China) and come down. If uncontrolled, then the base would be extended to the whole world (similar to common flu which affects the world 2 times yearly, during winter time in northern / southern world, every 6 months).
Networking (more interactions among people) is useful for business growth. Networking is also harmful for virus growth. So, there is a conflict of interest, virus growth and business growth are aligned at certain time. So, the virtual social network such as Facebook would benefit, future 5G technology may also encourage more networking without physically meet-up, minimizing the chances for new virus to spread.
Risk within Singapore is still low as all affected cases could be traced back to China tourists (which travelling to Singapore is banned from 1 Feb 2020) and fatality outside China is low (less than 1%, 0 death in Singapore).
We should still continue with the normal daily life (work, study, etc) while taking precautionary measures with positive habits in personal hygiene.
Each crisis (eg. Dotcom bubble crash, 911, SARS, Gulf War, Subprime Crisis, etc) could be potential opportunity for those who are prepared. Meanwhile, some stocks (eg. transportation, F&B, consumer discretionary, etc) could be under significant correction in price below value over next 6-12 months if Coronavirus continues to spread.
For short term (less than 3 months), global stock market has accepted the current condition of Coronavirus, starting to show sign of technical rebound. Positioning based on Technical Analysis for short term trading is still reasonable for bullish stock market such as US or selected sectors and stocks globally with bullish trends.
For medium term (less than 1 year), when China economy continues to slow down (eg. GDP drops from 6% to 5%), it will have significant impact on global economy. During 2003 SARS period, China contributed only to about 5% world GDP, but now China contributes to about 15% world GDP, implying effect of Coronavirus could be 3 times more than SARS as when China is sneezing, world would catch the cold.
For long term (5-10 years), the best opportunity of global financial crisis has not yet arrived as global stock market optimism is still high. However, a smart investor should prepare in advance (eg. sell at high or fair price, keeping cash as opportunity fund).
Learn to convert crisis into opportunity through stock investing with free 4hr Course by Dr Tee: www.ein55.com

